
In June 2025, EPA conducted an anonymous survey on salaries and benefits of its members, commissioned by the EPA Board of Directors and conducted by 5by5, an independent research firm based in Nashville.
This is the fourth time EPA has conducted this survey with prior surveys in 2016, 2019, and 2022.
The survey was promoted through a postcard mailing and a series of emails to 521 individuals. The contact list was made up of staff names from current EPA member publications, numbering more than 200. EPA does not know how many total workers are employed by all publications.
There were 91 responses to the survey, 18% of the targeted group. EPA does not know how many publications or which publications are represented in the survey.
The charts and statistics in this post reflect the key findings from the survey. For the downloadable report, click here.
For the 2022 survey results, click here.
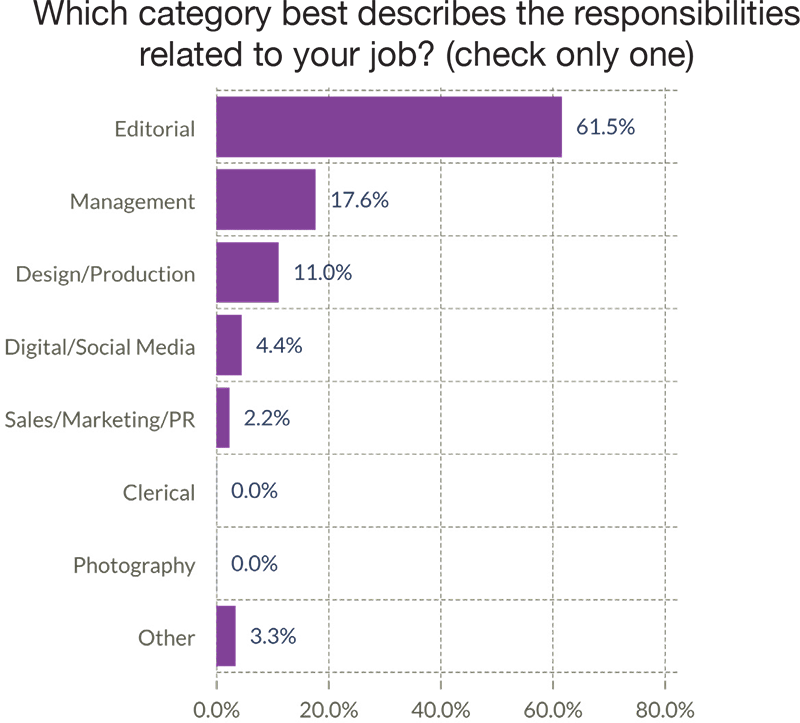
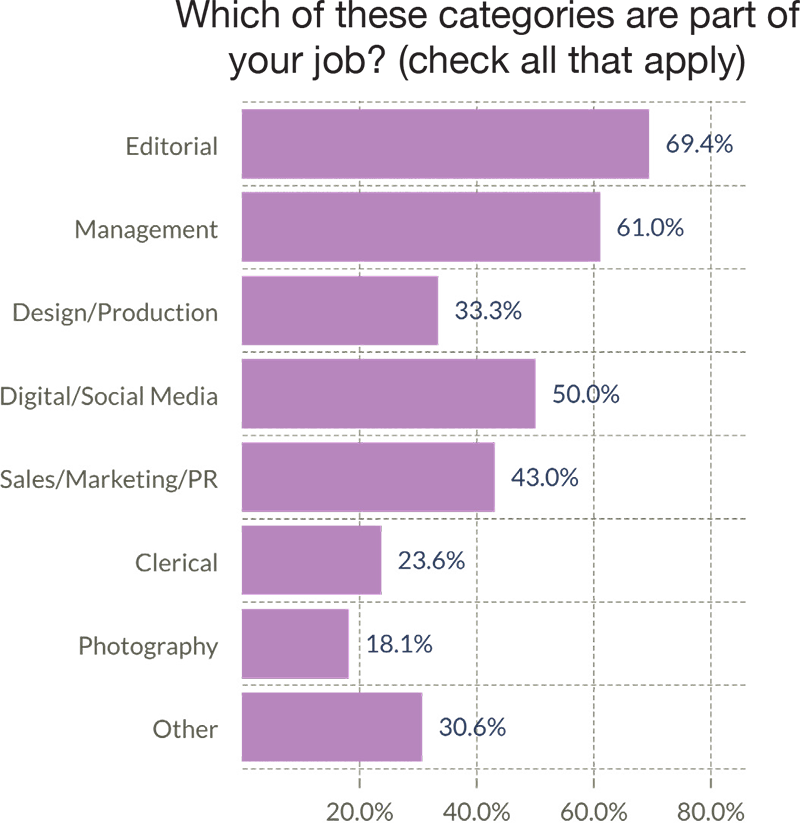
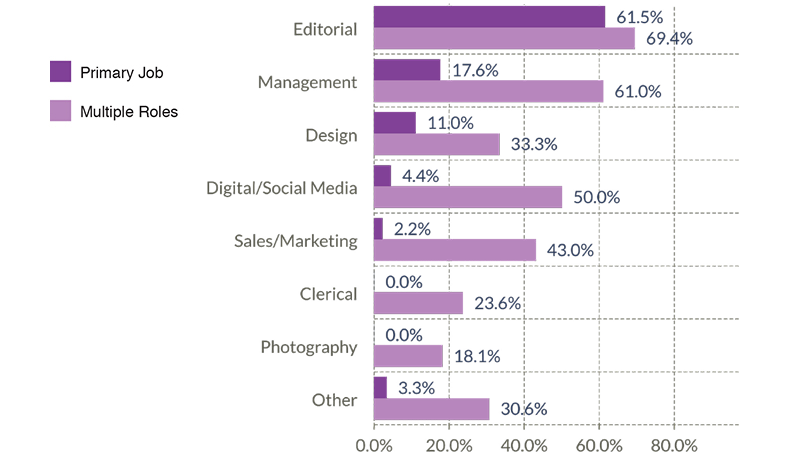
The next graph combines both charts from above. The light purple bar illustrates the percentage of all workers who perform some of these responsibilities, whether or not it is their primary job. For example, while only 4.4% of jobs are primarily Digital/Social Media (dark purple bar), 50.0% of jobs have at least some responsibilities in Digital/Social Media (light purple bar).
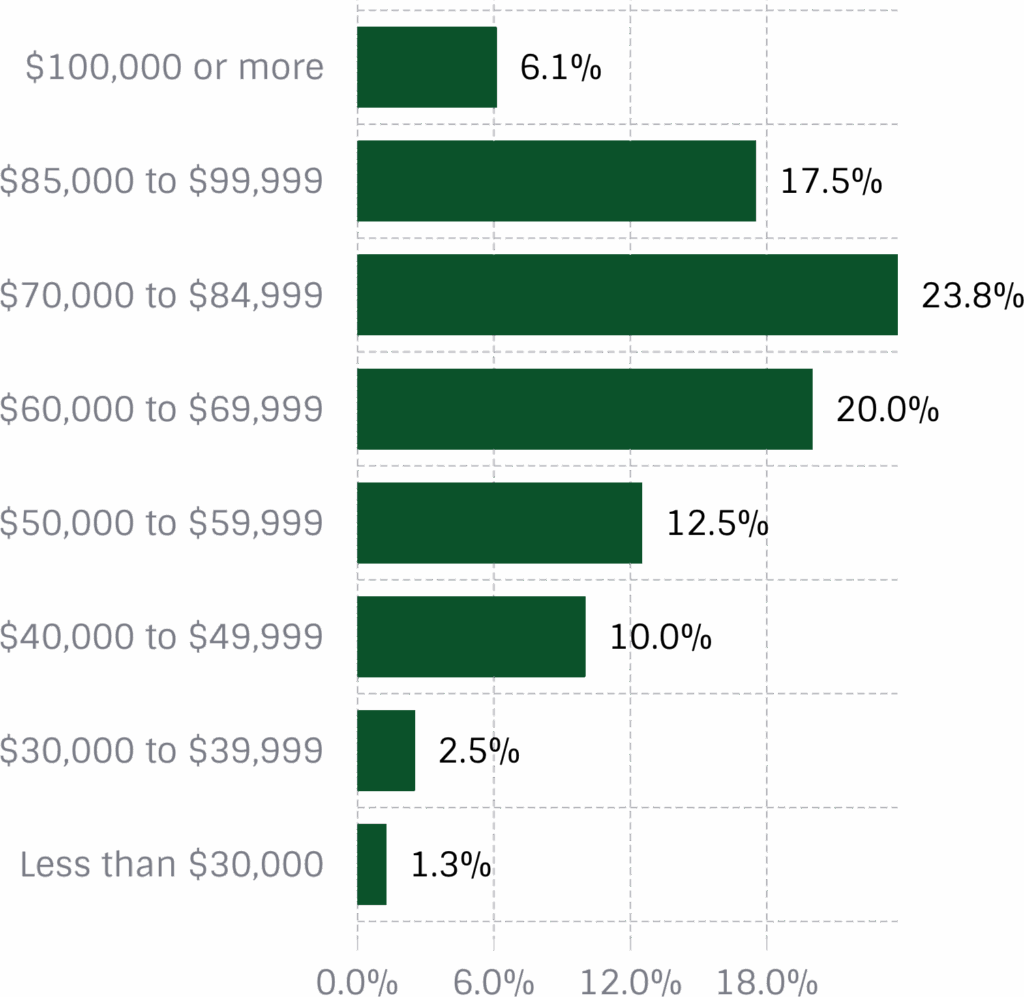
Salary Range – Full-time
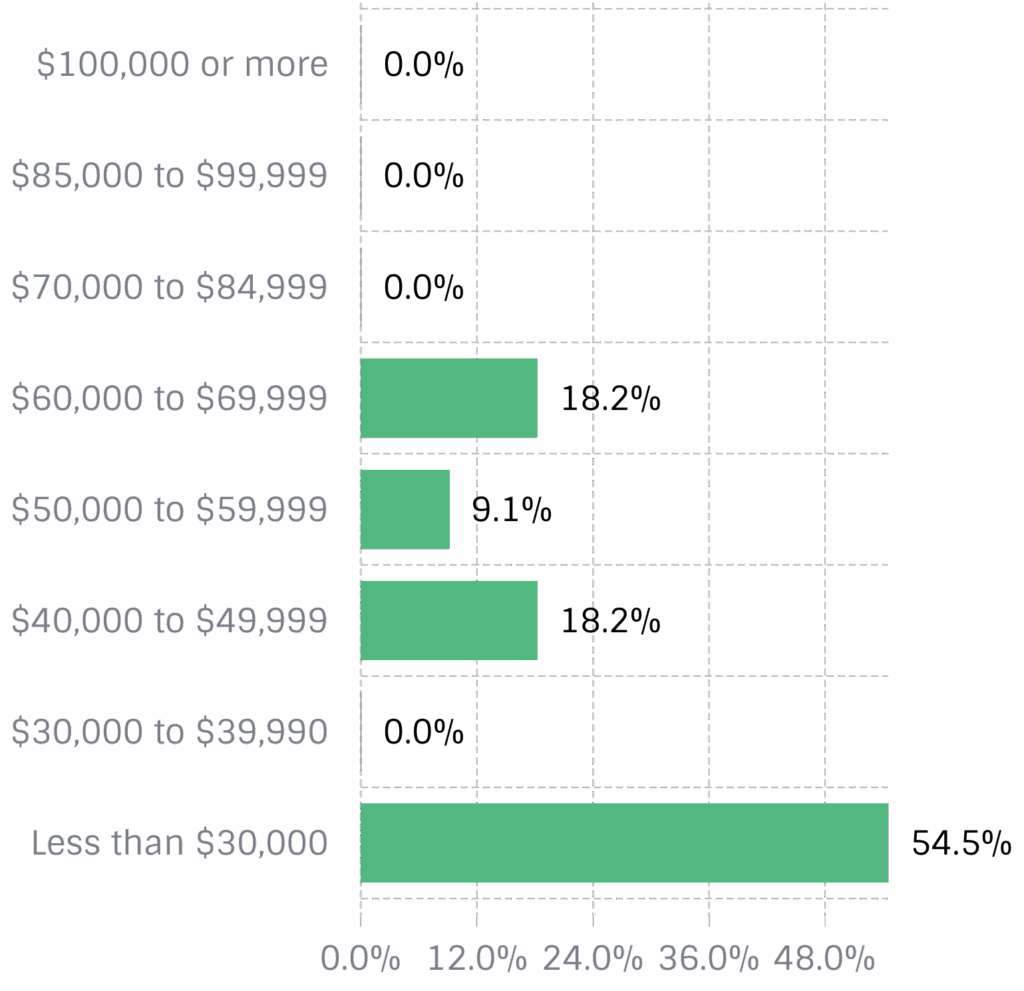
Salary Range – Part-time
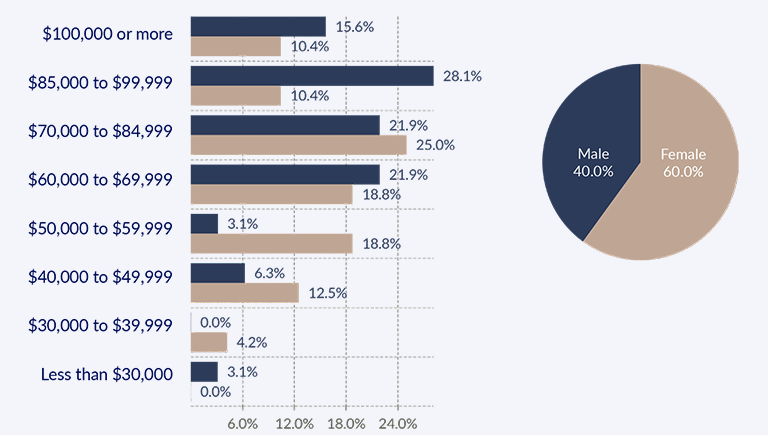
Salary Range by Gender
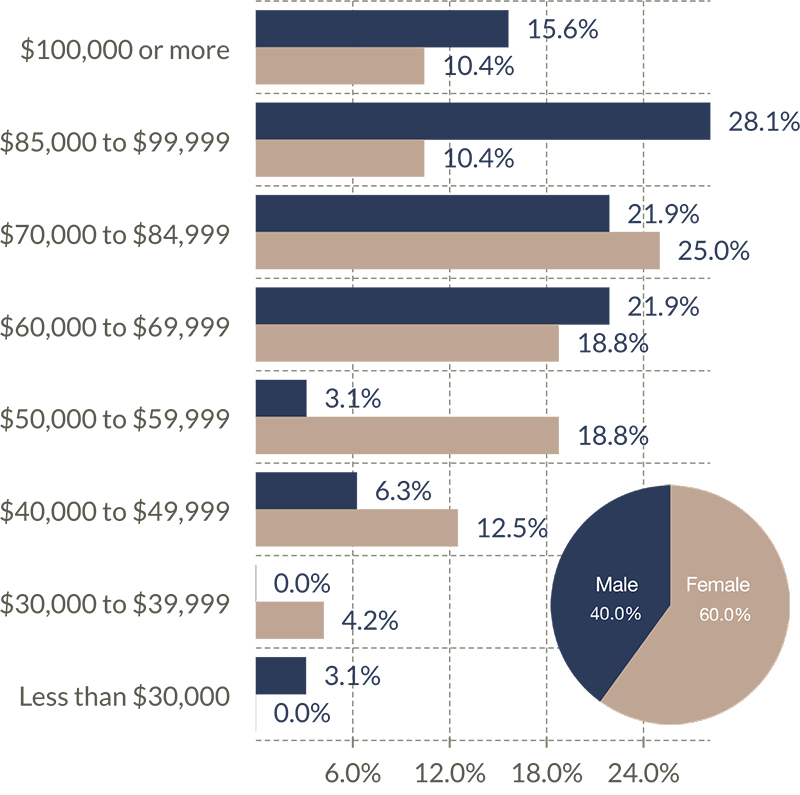
The following chart shows the aggregate salary ranges for both female and male with combined levels equal to 100%.


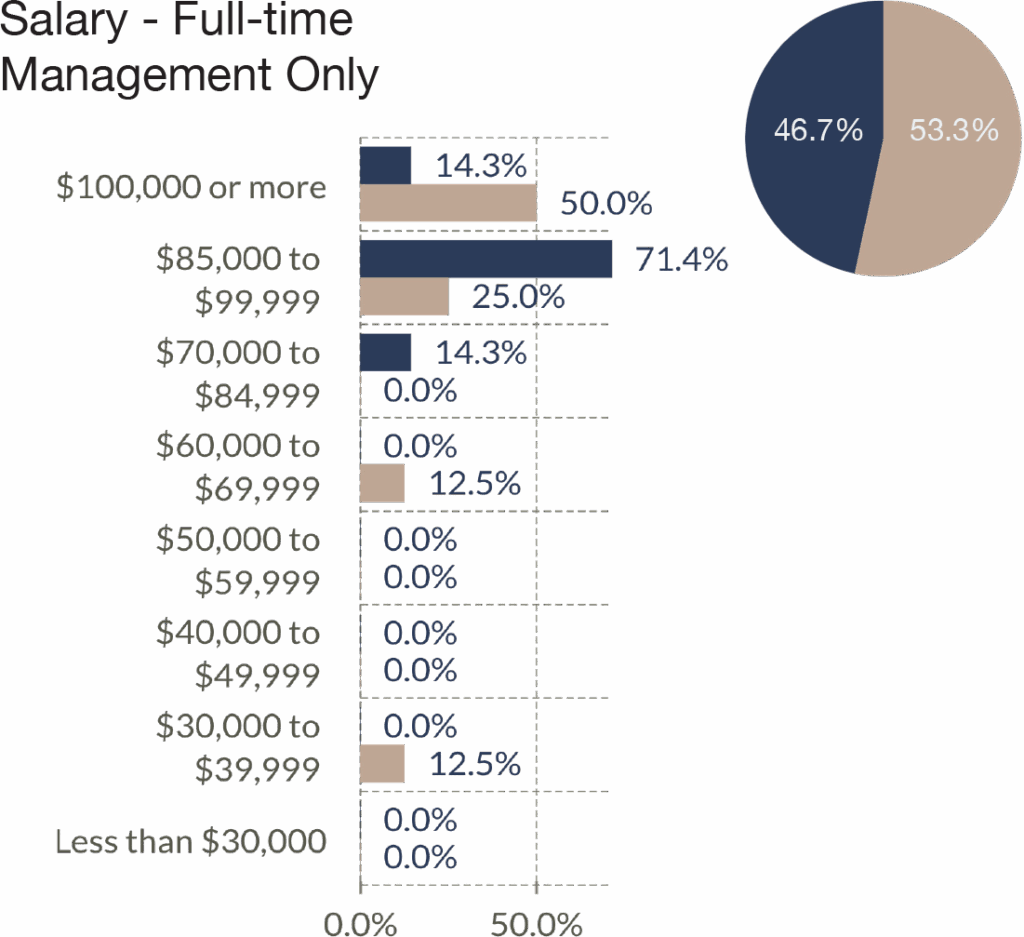
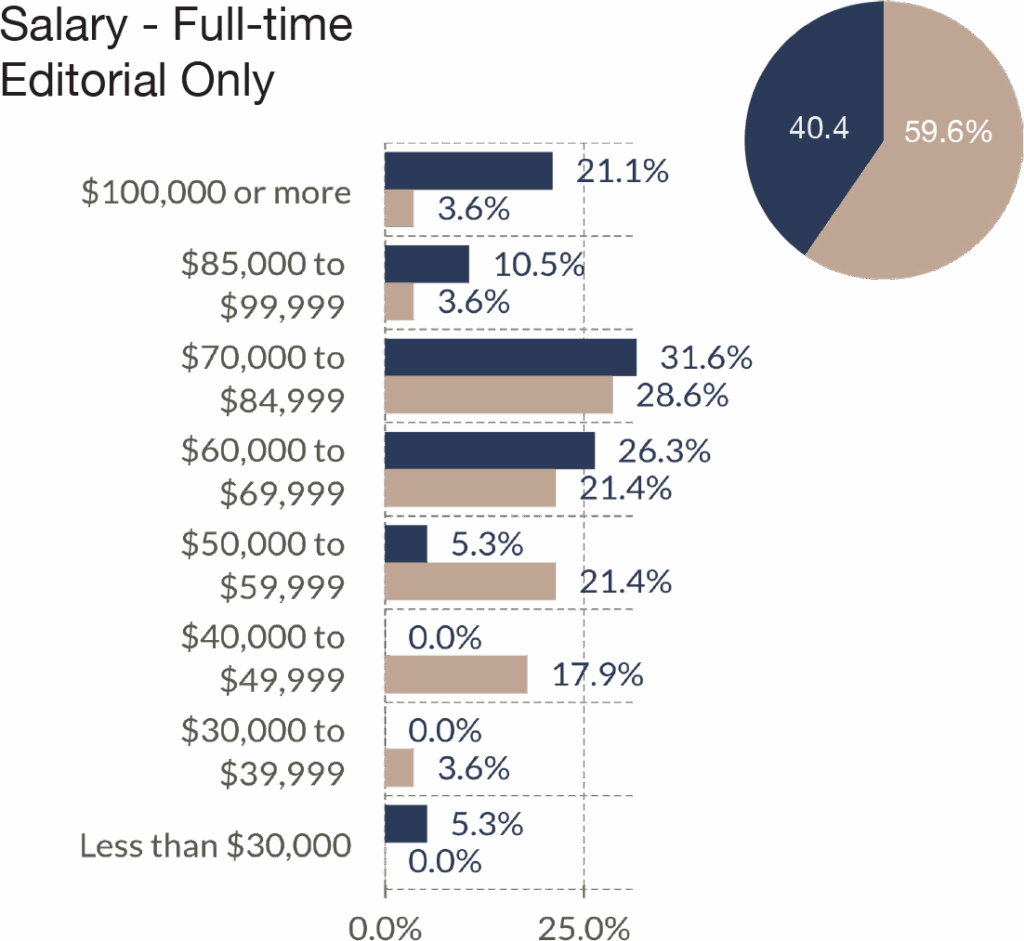
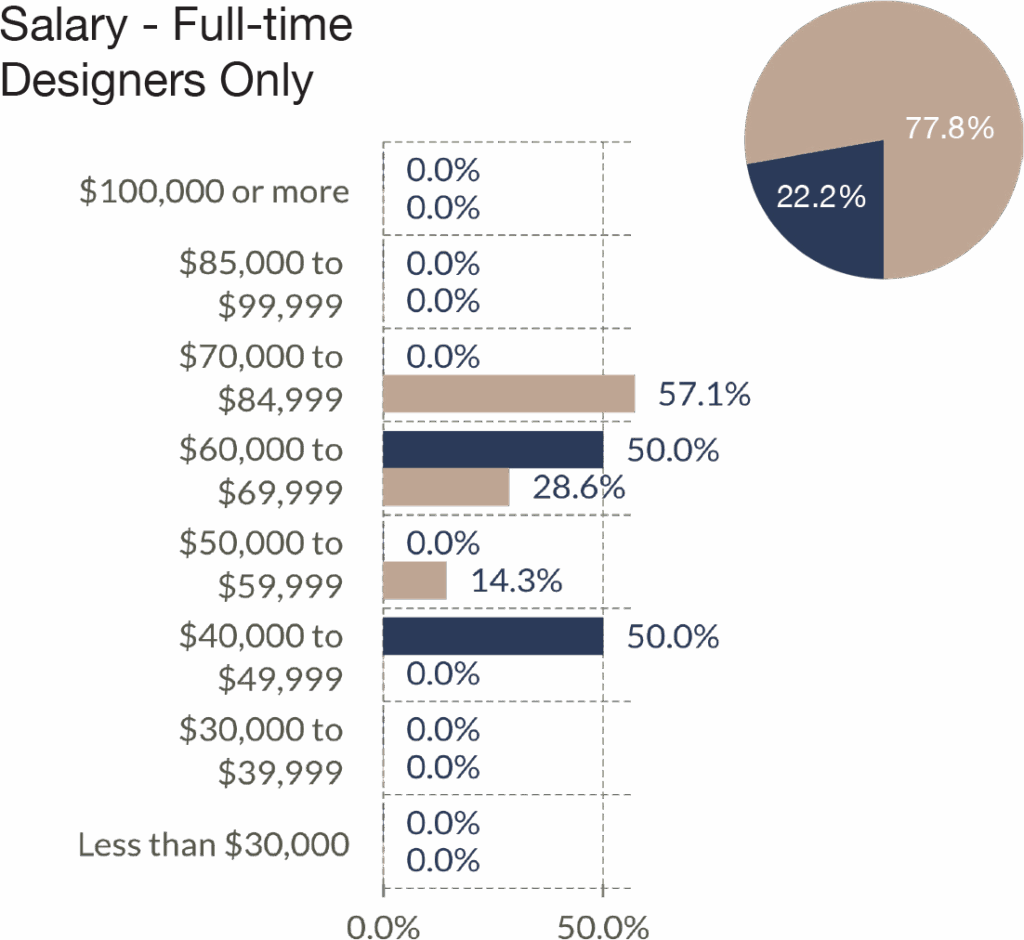
The next three graphs illustrate salary ranges broken out by the three primary categories of full-time workers.
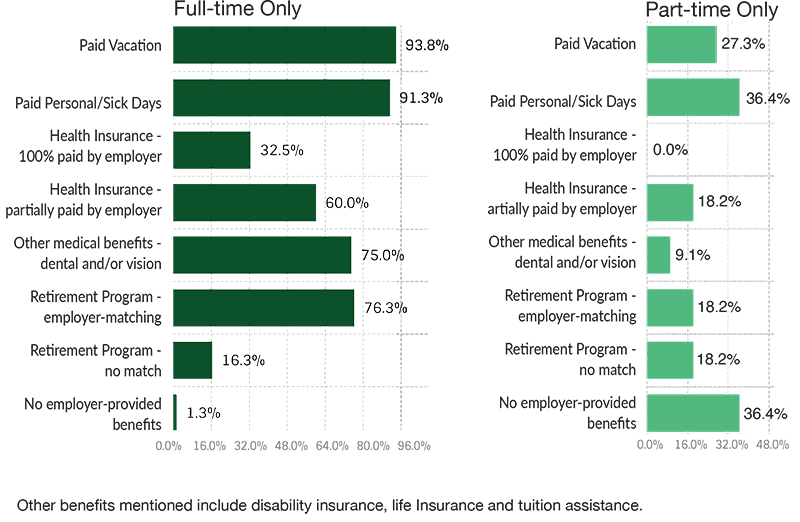
Benefits Offered
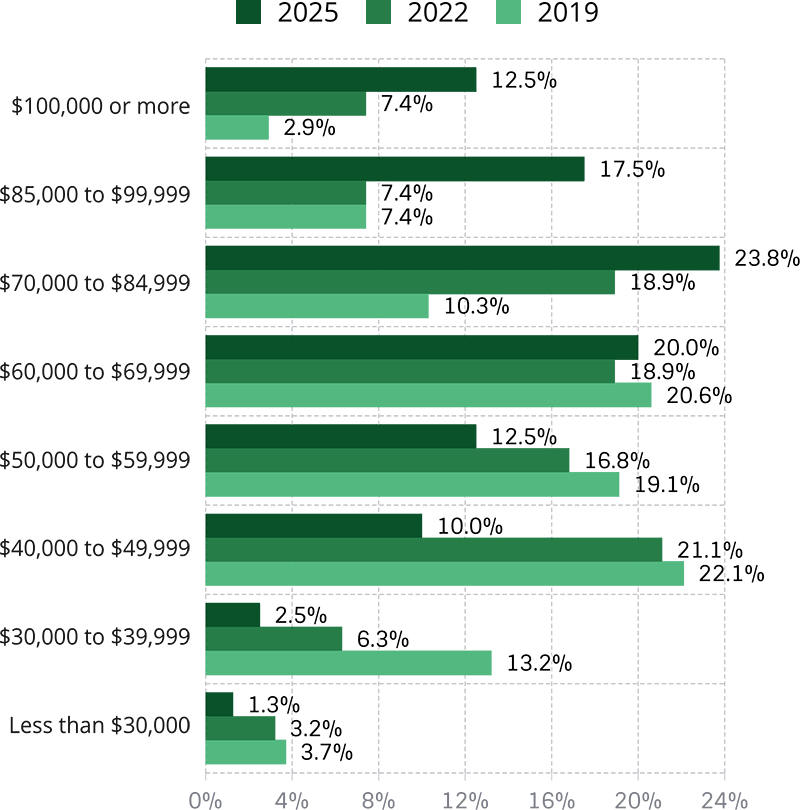
Comparing Salary Ranges
This compares salary ranges and the percentage of those paid within those ranges — from our triennial surveys in 2019, 2022 and 2025. The first graph (green) includes all full-time salaries.
Full-Time Salaries Compared by Years
Full-Time Salaries Compared by Years – Female
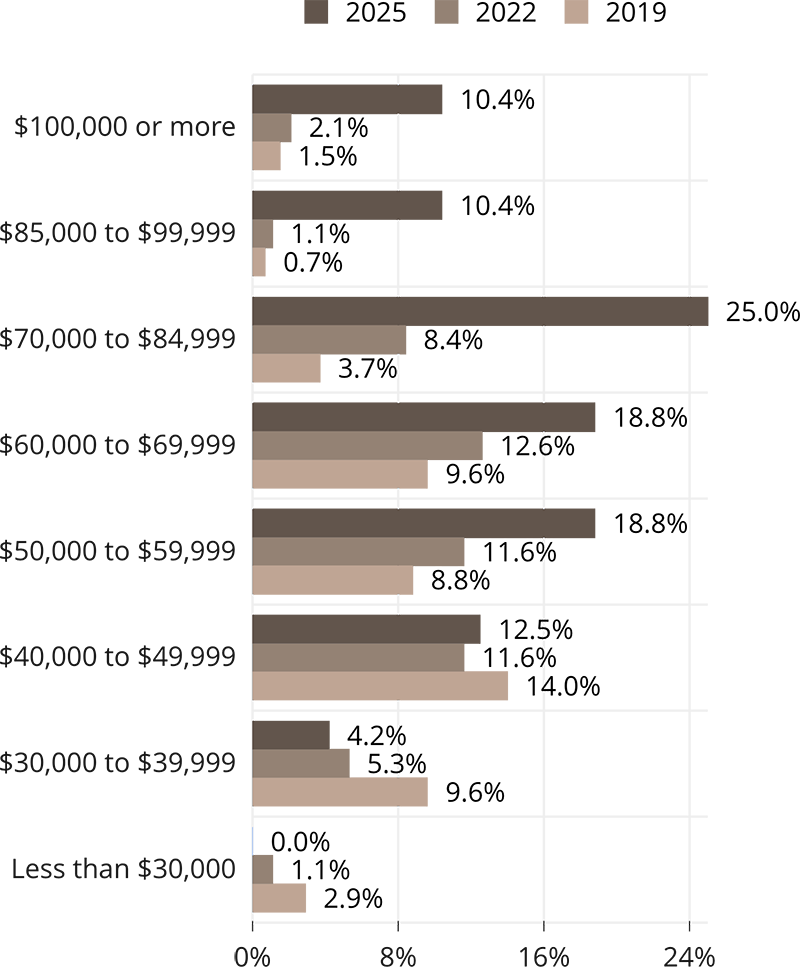
![]()
Full-Time Salaries Compared by Years – Male

![]()
Comparing Salary Levels
This compares the percentage of those paid above or below varying levels — from our triennial surveys in 2019, 2022 and 2025.
Full-time Salary Levels

Full-time Salary Levels – Female

Full-time Salary Levels – Male

Significant Points of Change since 2022
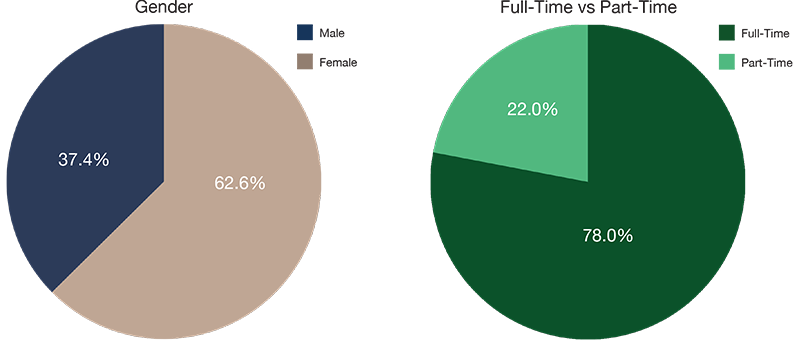
- Female vs. male gender majority increased from 59.7% to 62.6% when considering both full-time and part-time roles
- Female vs. male gender majority increased from 53.7% to 60.0% when considering only full-time roles
- Full-time vs. part-time status decreased from 83.3% to 78.0% (10% lower than 2019)
- Those whose roles include management responsibilities increased from 48.2% to 61.0%
- Those whose roles include editorial responsibilities decreased from 90.4% to 69.4%
- Those whose roles included clerical duties was relatively unchanged at 23.6%
- Those whose roles include digital/social media responsibilities was relatively unchanged at 50.0%
- 54% earn $70,000 or more (compared to 34% in 2022 and 20% in 2019)
- 74% earn $60,000 or more (compared to 53% in 2022 and 41% in 2019)
- 86% earn $50,000 or more (compared to 66% in 2022 and 60% in 2019)
- 14% earn less than $50,000 (compared to 31% in 2022 and 40% in 2019)
- The primary full-time salary range increased from $50,000 to $85,000 to $60,000 to $85,000
- The percentage of males earning $60,000 or more increased from 61% to 66%
- The percentage of females earning $60,000 or more increased 45% to 65%
Posted September 4, 2025